6625 South Hiwassee Road, Oklahoma City, OK 73150
Commercial property record · Oklahoma County · Commercial · Oklahoma City commercial real estate
Public record for 6625 South Hiwassee Road in Oklahoma City, OK: who owns it, what the county assesses it at, land use and lot size, plus flood zone, natural hazard risk and EPA records. Free, no account needed.
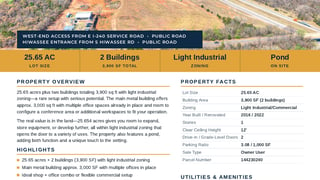
On the market here
At a glance
Public data gathered Nov 9, 2026.
Flood
Outside FEMA's 100-year floodplain No concern on record.
Flood zone X
Natural hazards
Low risk overall No concern on record.
No hazard rated high
Environmental
1 EPA-tracked facility within a mile Worth a closer look.
No severe violators; no open leaking-tank cases within half a mile
People nearby
761 people within a mile
Median household income $83,522
Getting there
Highway exit: I 240 / OK 3 Exit 14 · 0.7 mi
Airport: Tinker Air Force Base (TIK) · 5.5 mi
Property records for 6625 South Hiwassee Road
Owner and assessed value
Researched Nov 9, 2026Tax lots
1 lot| Parcel number | Acres | Assessed | Market | Annual tax |
|---|---|---|---|---|
| R1442302401 | 24.41 | $62,130 | $833,000 | $7,978 |
Recorded sales
| Date | Price | Instrument | Document | Buyer | Seller |
|---|---|---|---|---|---|
| Aug 25, 20221 | $487,500 | Deeds | Book 15254 Page 1691 | TEXOLA INC | RUSTIC CANNIBAL PROPERTIES LLC |
| Aug 17, 20151 | $200,000 | Deeds | Book 12911 Page 602 | RUSTIC CANNIBAL PROPERTIES LLC | IBISON EUGENE ETAL IBISON KAREN |
| Aug 10, 20071 | — | Hmstd Off & | Book 10576 Page 1236 | IBISON EUGENE ETAL IBISON KAREN | IBISON EUGENE W SR |
Sources
- 1 docs.oklahomacounty.org · docs.oklahomacounty.org
Figures as the county publishes them. Each source links to the page it was read from and, where the county published a document, to a copy kept on the day it was read.
Due diligence
 Find a commercial property inspector Book a certified commercial inspector in this area.
 Investment Property Analyzer Run the numbers on this property before you offer. Free.
From our partner CCPIA — the Certified Commercial Property Inspectors Association
Flood zone, hazard risk and the area around it
Getting there
Straight-line distance- Highway exit
- I 240 / OK 3 Exit 14 · 0.7 mi
- Airport
- Tinker Air Force Base (TIK) · 5.5 mi
- International airport
- Will Rogers International Airport (OKC) · 17.1 mi
Within a mile: 0 restaurants · 0 shops · 0 grocery stores · 0 schools · 0 parks
Distances and places from © OpenStreetMap contributors.
Demographics
U.S. Census ACS · 2019–2023 · LEHD| Statistic | 1 mi | 3 mi | 5 mi |
|---|---|---|---|
| Population | 761 | 8,440 | 34,419 |
| Jobs (people working here) | 57 | 1,123 | 4,426 |
| Daytime population (est.) | 501 | 5,996 | 24,690 |
| Median household income | $83,522 | $111,824 | $96,786 |
Household income
Share of households · 1 mi- Under $25k
- 0%
- 0
- $25k–$50k
- 19%
- 46
- $50k–$100k
- 49%
- 119
- $100k–$200k
- 15%
- 37
- $200k+
- 17%
- 41
Population by age
Share of residents · 1 mi- Under 18
- 28%
- 216
- 18–24
- 4%
- 30
- 25–34
- 13%
- 98
- 35–44
- 10%
- 78
- 45–54
- 17%
- 126
- 55–64
- 12%
- 92
- 65–74
- 4%
- 32
- 75+
- 12%
- 89
Housing
Share of housing units · 1 mi- Owner occupied
- 80%
- 208
- Renter occupied
- 14%
- 35
- Vacant
- 6%
- 16
Median income by age
Age of householder · 1 mi- 25–44
- $84,469
- 45–64
- $198,749
- 65+
- $60,469
Jobs by industry
Share of jobs · 1 mi- Retail, food & lodging
- 11%
- 6
- Health care
- 0%
- 0
- Education
- 4%
- 2
- Professional & finance
- 0%
- 0
- Construction & manufacturing
- 82%
- 47
- Wholesale & logistics
- 0%
- 0
- Government
- 0%
- 0
- Other services
- 4%
- 2
Education
Share of adults 25+ · 1 mi- No HS diploma
- 7%
- 38
- High school
- 28%
- 144
- Some college
- 39%
- 200
- Bachelor's
- 21%
- 107
- Graduate
- 5%
- 26
Race & ethnicity
Share of residents · 1 mi- White
- 77%
- 587
- Black or African American
- 2%
- 16
- Asian
- 0%
- 0
- Two or more races
- 20%
- 152
- Other
- 1%
- 6
Hispanic or Latino, of any race 10%
Natural hazard risk
FEMA National Risk Index · December 2025- Overall
- Low
- Tornado
- Moderate
- Hail
- Moderate
- Heat wave
- Moderate
- Ice storm
- Moderate
- Flooding (inland)
- Low
- Wildfire
- Low
- Cold wave
- Low
- Winter weather
- Low
- Hurricane
- Very Low
- Strong wind
- Very Low
- Lightning
- Very Low
- Earthquake
- Very Low
- Landslide
- Very Low
Ratings are for the census tract, relative to all U.S. tracts — not a parcel-level model.
- EPA-Tracked Facilities Within 1 Mile
- 1
- Toxic-Release Facilities Within 1 Mile
- 0
- EPA Severe Violators Within 1 Mile
- 0
- Open Leaking-Tank Cases Within ½ Mile
- 0
- Leaking-Tank Releases Within ½ Mile
- 0
- Underground Tank Sites Within ¼ Mile
- 0
- In FEMA Special Flood Hazard Area
- No
Location & Zoning
- FEMA Flood Zone
- X
- Opportunity Zone
- No