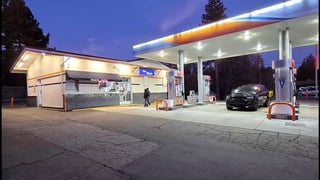
32124 Hilltop Boulevard, Running Springs, CA 92382
Commercial property record · San Bernardino County · Convenience store w/gas · Running Springs commercial real estate
Public record for 32124 Hilltop Boulevard in Running Springs, CA: land use and lot size, plus flood zone, natural hazard risk and EPA records. Free, no account needed.
On the market here
At a glance
Some public sources did not answer. Showing what came back.
Flood
Outside FEMA's 100-year floodplain No concern on record.
Flood zone D
Natural hazards
Very high risk overall Worth a closer look.
Wildfire and landslide rated very high; flooding (inland) and earthquake rated high
Environmental
85 EPA-tracked facilities within a mile Worth a closer look.
No severe violators; 1 open leaking-tank case within half a mile
People nearby
1,158 people within a mile
Median household income $67,500
Getting there
Highway exit: CA 330 · 6.9 mi
International airport: San Bernardino International Airport (SBD) · 10.6 mi
Property records for 32124 Hilltop Boulevard
County record
Researched Nov 1, 2026Tax lots
1 lot| Parcel number | Acres |
|---|---|
| 0295222141 | 0.37 |
Sources
- 1 Parcels for San Bernardino County · services.arcgis.com
Figures as the county publishes them. Each source links to the page it was read from and, where the county published a document, to a copy kept on the day it was read.
Due diligence
 Find a commercial property inspector Book a certified commercial inspector in this area.
 Investment Property Analyzer Run the numbers on this property before you offer. Free.
From our partner CCPIA — the Certified Commercial Property Inspectors Association
Flood zone, hazard risk and the area around it
Getting there
Straight-line distance- Highway exit
- CA 330 · 6.9 mi
- International airport
- San Bernardino International Airport (SBD) · 10.6 mi
Nearby brands
Nearest location · within 1 mi- 76 Fuel
- <0.1 mi
- Valero Fuel
- 0.9 mi
Distances and places from © OpenStreetMap contributors.
Demographics
U.S. Census ACS · 2019–2023 · LEHD| Statistic | 1 mi | 3 mi | 5 mi |
|---|---|---|---|
| Population | 1,158 | 3,256 | 5,664 |
| Jobs (people working here) | 80 | 233 | 670 |
| Daytime population (est.) | 832 | 1,946 | 3,528 |
| Median household income | $67,500 | $87,908 | $86,722 |
Household income
Share of households · 1 mi- Under $25k
- 20%
- 87
- $25k–$50k
- 14%
- 62
- $50k–$100k
- 39%
- 171
- $100k–$200k
- 22%
- 94
- $200k+
- 5%
- 23
Population by age
Share of residents · 1 mi- Under 18
- 27%
- 312
- 18–24
- 8%
- 91
- 25–34
- 5%
- 63
- 35–44
- 23%
- 267
- 45–54
- 5%
- 58
- 55–64
- 9%
- 99
- 65–74
- 18%
- 203
- 75+
- 6%
- 65
Housing
Share of housing units · 1 mi- Owner occupied
- 42%
- 308
- Renter occupied
- 17%
- 129
- Vacant
- 41%
- 304
Median income by age
Age of householder · 1 mi- 25–44
- $71,379
- 45–64
- $83,500
- 65+
- $55,789
Jobs by industry
Share of jobs · 1 mi- Retail, food & lodging
- 8%
- 6
- Health care
- 10%
- 8
- Education
- 0%
- 0
- Professional & finance
- 8%
- 6
- Construction & manufacturing
- 28%
- 22
- Wholesale & logistics
- 4%
- 3
- Government
- 0%
- 0
- Other services
- 44%
- 35
Education
Share of adults 25+ · 1 mi- No HS diploma
- 12%
- 91
- High school
- 14%
- 108
- Some college
- 34%
- 255
- Bachelor's
- 30%
- 228
- Graduate
- 10%
- 73
Race & ethnicity
Share of residents · 1 mi- White
- 52%
- 600
- Black or African American
- 0%
- 0
- Asian
- 3%
- 39
- Two or more races
- 27%
- 312
- Other
- 18%
- 207
Hispanic or Latino, of any race 32%
Natural hazard risk
FEMA National Risk Index · December 2025- Overall
- Very High
- Wildfire
- Very High
- Landslide
- Very High
- Flooding (inland)
- High
- Earthquake
- High
- Strong wind
- Low
- Hail
- Low
- Lightning
- Low
- Heat wave
- Low
- Cold wave
- Low
- Winter weather
- Low
- Avalanche
- Low
- Tornado
- Very Low
- Drought
- Very Low
Ratings are for the census tract, relative to all U.S. tracts — not a parcel-level model.
- EPA-Tracked Facilities Within 1 Mile
- 85
- Toxic-Release Facilities Within 1 Mile
- 0
- EPA Severe Violators Within 1 Mile
- 0
- Open Leaking-Tank Cases Within ½ Mile
- 1
- Leaking-Tank Releases Within ½ Mile
- 2
- Underground Tank Sites Within ¼ Mile
- 1
- In FEMA Special Flood Hazard Area
- No
Location & Zoning
- FEMA Flood Zone
- D
- Opportunity Zone
- No